What Is Market Structure in Trading?
Updated 23 Mar 2026
If you have ever stared at a chart and felt like you were reading noise, market structure is the framework that changes that. It is the single most important concept in price action trading — and almost every other concept you will encounter builds on top of it.
Understanding market structure means understanding who is in control of the market at any given moment. Not indicators. Not moving averages. The raw structure of price itself.
What Is Market Structure in Trading?
Market structure is the framework formed by the sequence of highs and lows that price creates as it moves. Every time price moves up, pulls back, moves up again, or reverses — it is leaving behind a structural record. That record tells you whether buyers or sellers are in control, whether the trend is healthy or weakening, and where the market is likely to move next.
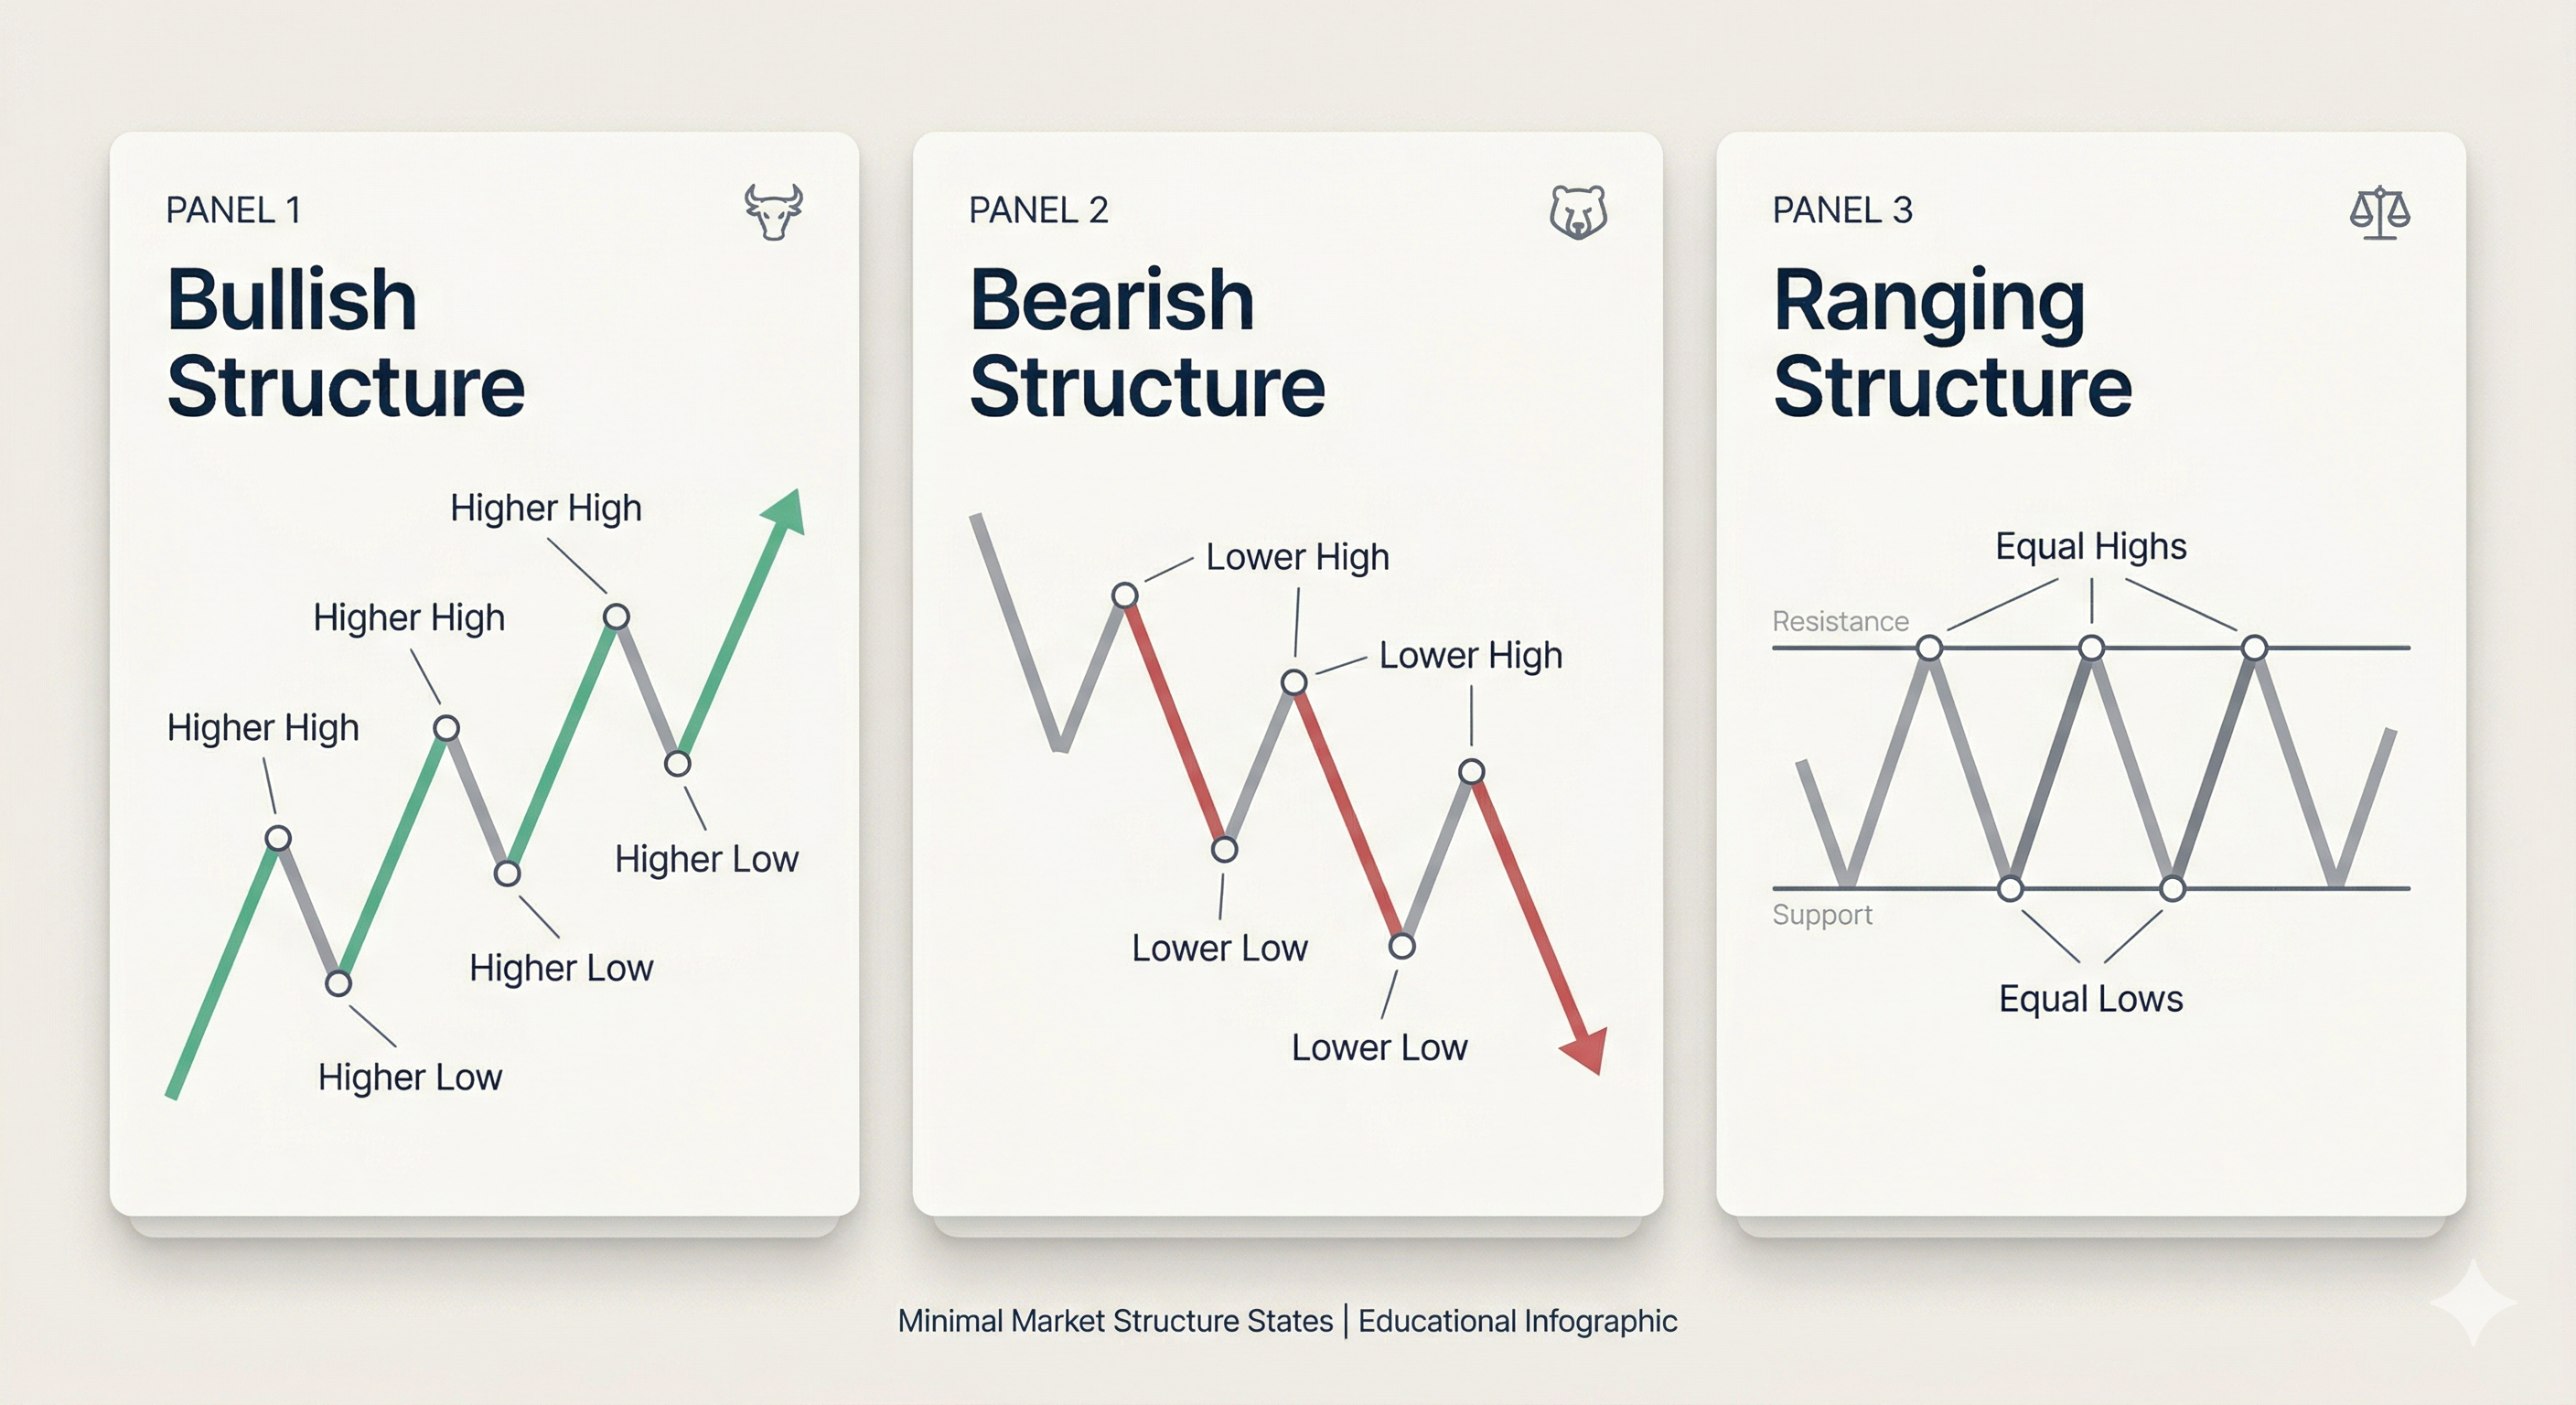
At its core, market structure breaks down into three states:
- Bullish structure — price is making higher highs and higher lows. Buyers are in control.
- Bearish structure — price is making lower highs and lower lows. Sellers are in control.
- Ranging structure — price is moving between two levels without clear directional bias. Neither side has control.
Before you place a trade, before you look at any entry trigger, you should know which of these three states the market is in on your relevant timeframe. Everything else flows from that.
Swing Highs and Swing Lows: The Building Blocks
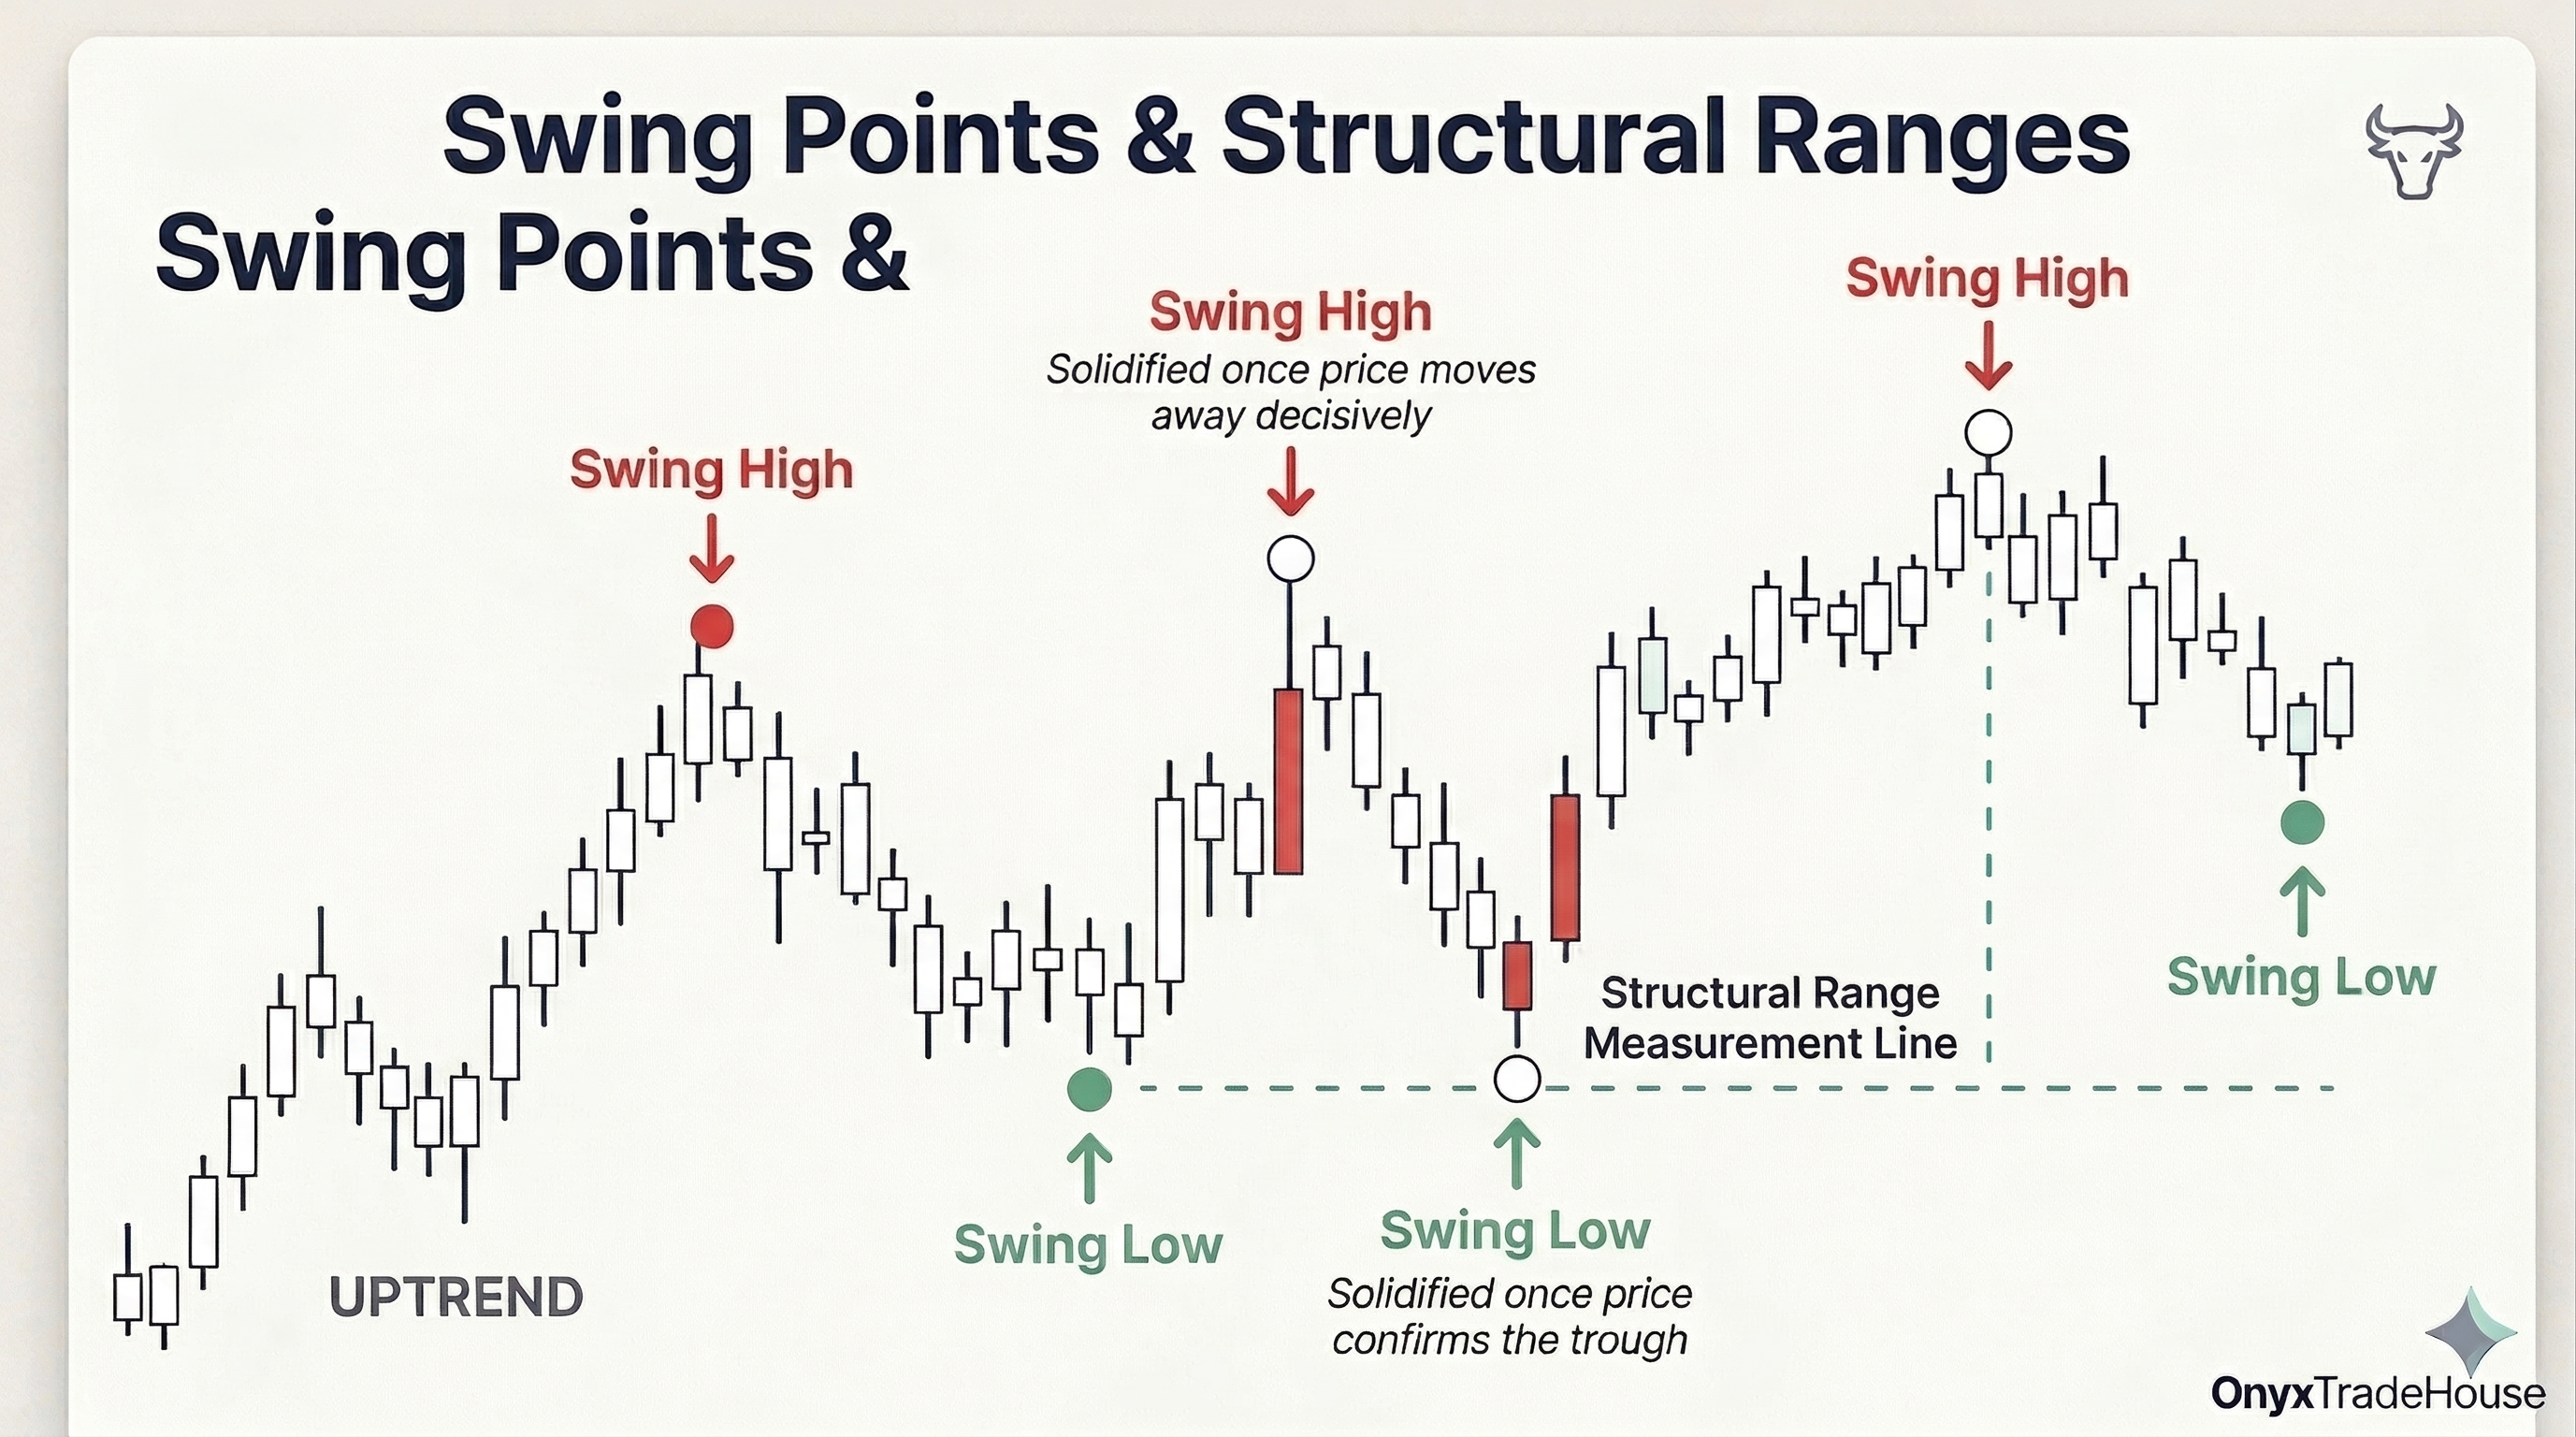
Market structure is built from swing highs and swing lows. A swing high is a peak — a point where price moved up, stalled, and then moved back down. A swing low is a trough — a point where price moved down, stalled, and then moved back up.
These points are not arbitrary. They represent real moments where buying or selling pressure shifted. They are the structural reference points you use to read everything that follows.
Within the OnyxTradeHouse framework, confirmed swing highs and lows are referred to as Solidified Points — they are only confirmed once price has moved away clearly, leaving a defined peak or trough on the chart. Until price confirms the move away, the point is not yet solidified.
The zone between two opposing Solidified Points — a high and a low — forms what we call a Structural Range. This is the operating range within which you look for your positions. Price moving within a range shows balance. A decisive break out of it signals a shift in momentum.
How to Read Market Structure Step by Step
Reading market structure is a skill that becomes faster with practice. Here is a process-driven approach to applying it on any chart:
Step 1 — Identify your swing points
Start on a higher timeframe — the daily or four-hour chart. Mark the most recent significant swing highs and swing lows. Do not mark every minor wiggle. Focus on the points that are visually obvious and where price spent time moving away from.
Step 2 — Determine the current structure state
Look at the sequence of those swing points. Are the highs getting higher? Are the lows getting higher too? That is bullish structure. Are the highs getting lower and the lows getting lower? Bearish structure. Is price bouncing between a consistent high and low? That is a range.
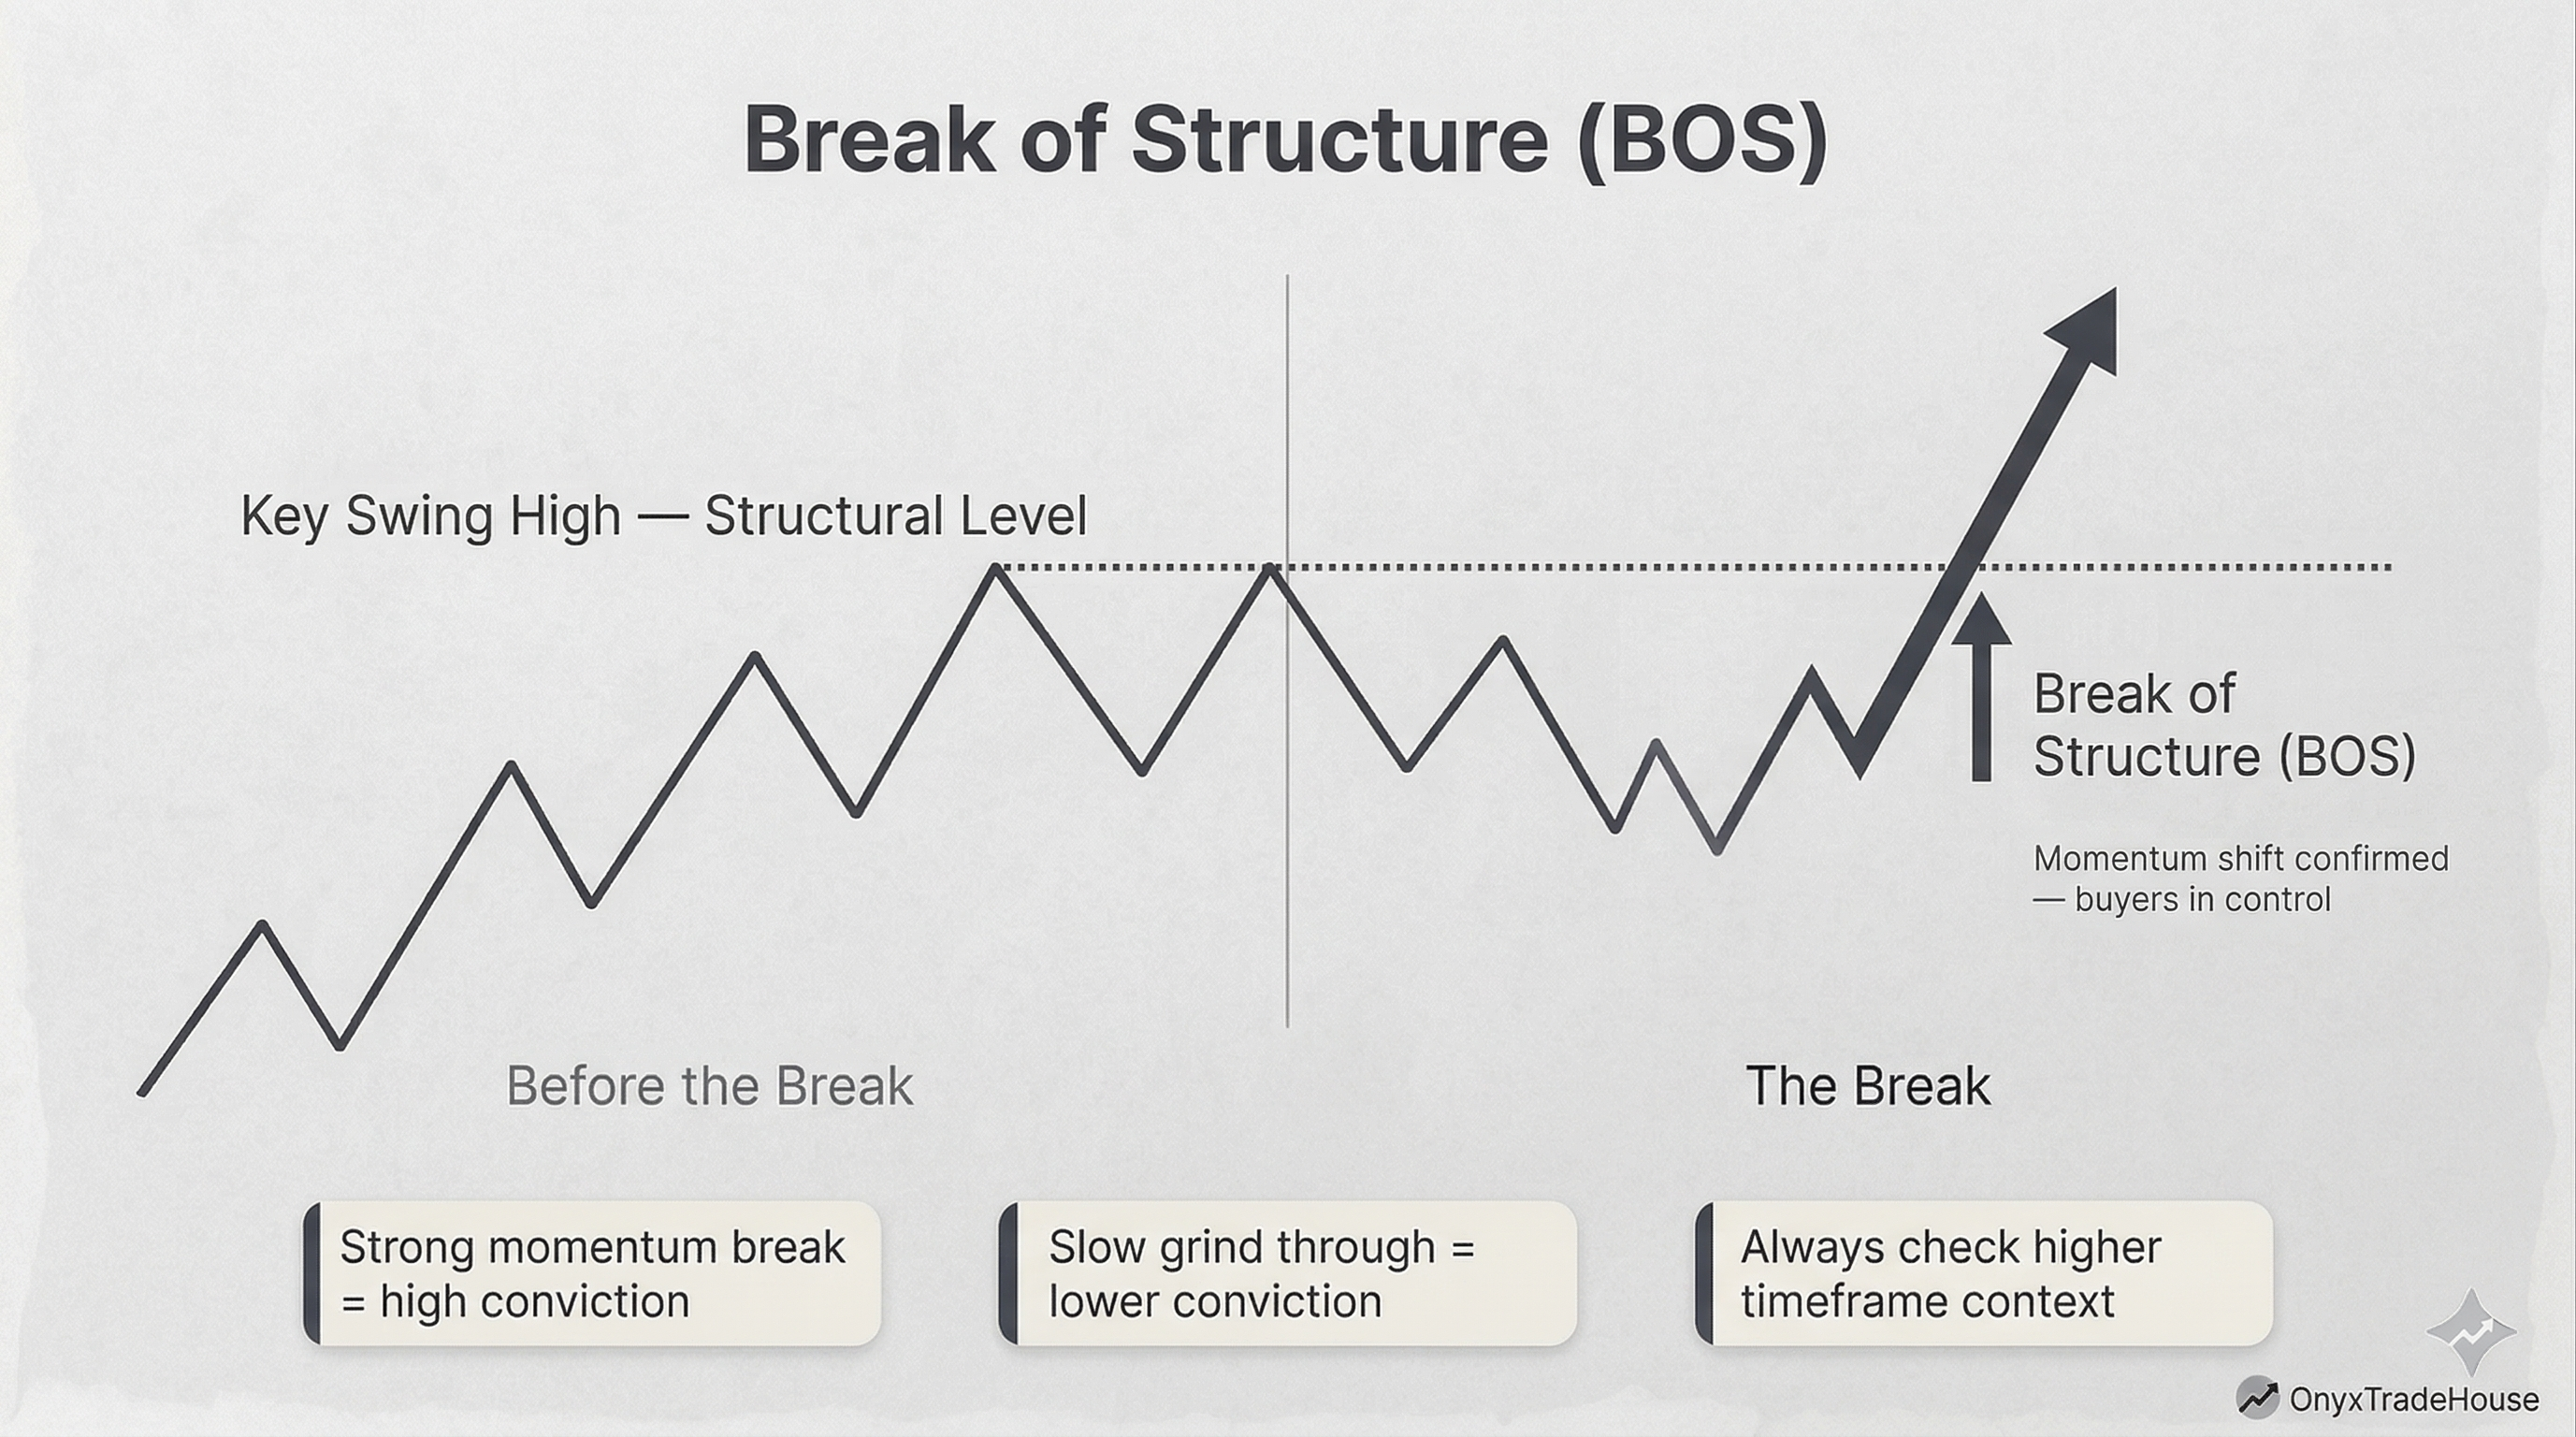
Step 3 — Watch for a Break of Structure
A Break of Structure (BOS) happens when price moves decisively through a Solidified Point. This is the signal that one side has taken control — or that the balance of power is shifting. Not all breaks are equal. A strong, high-momentum break through a major structural level carries far more weight than a slow, grinding move through a minor one.
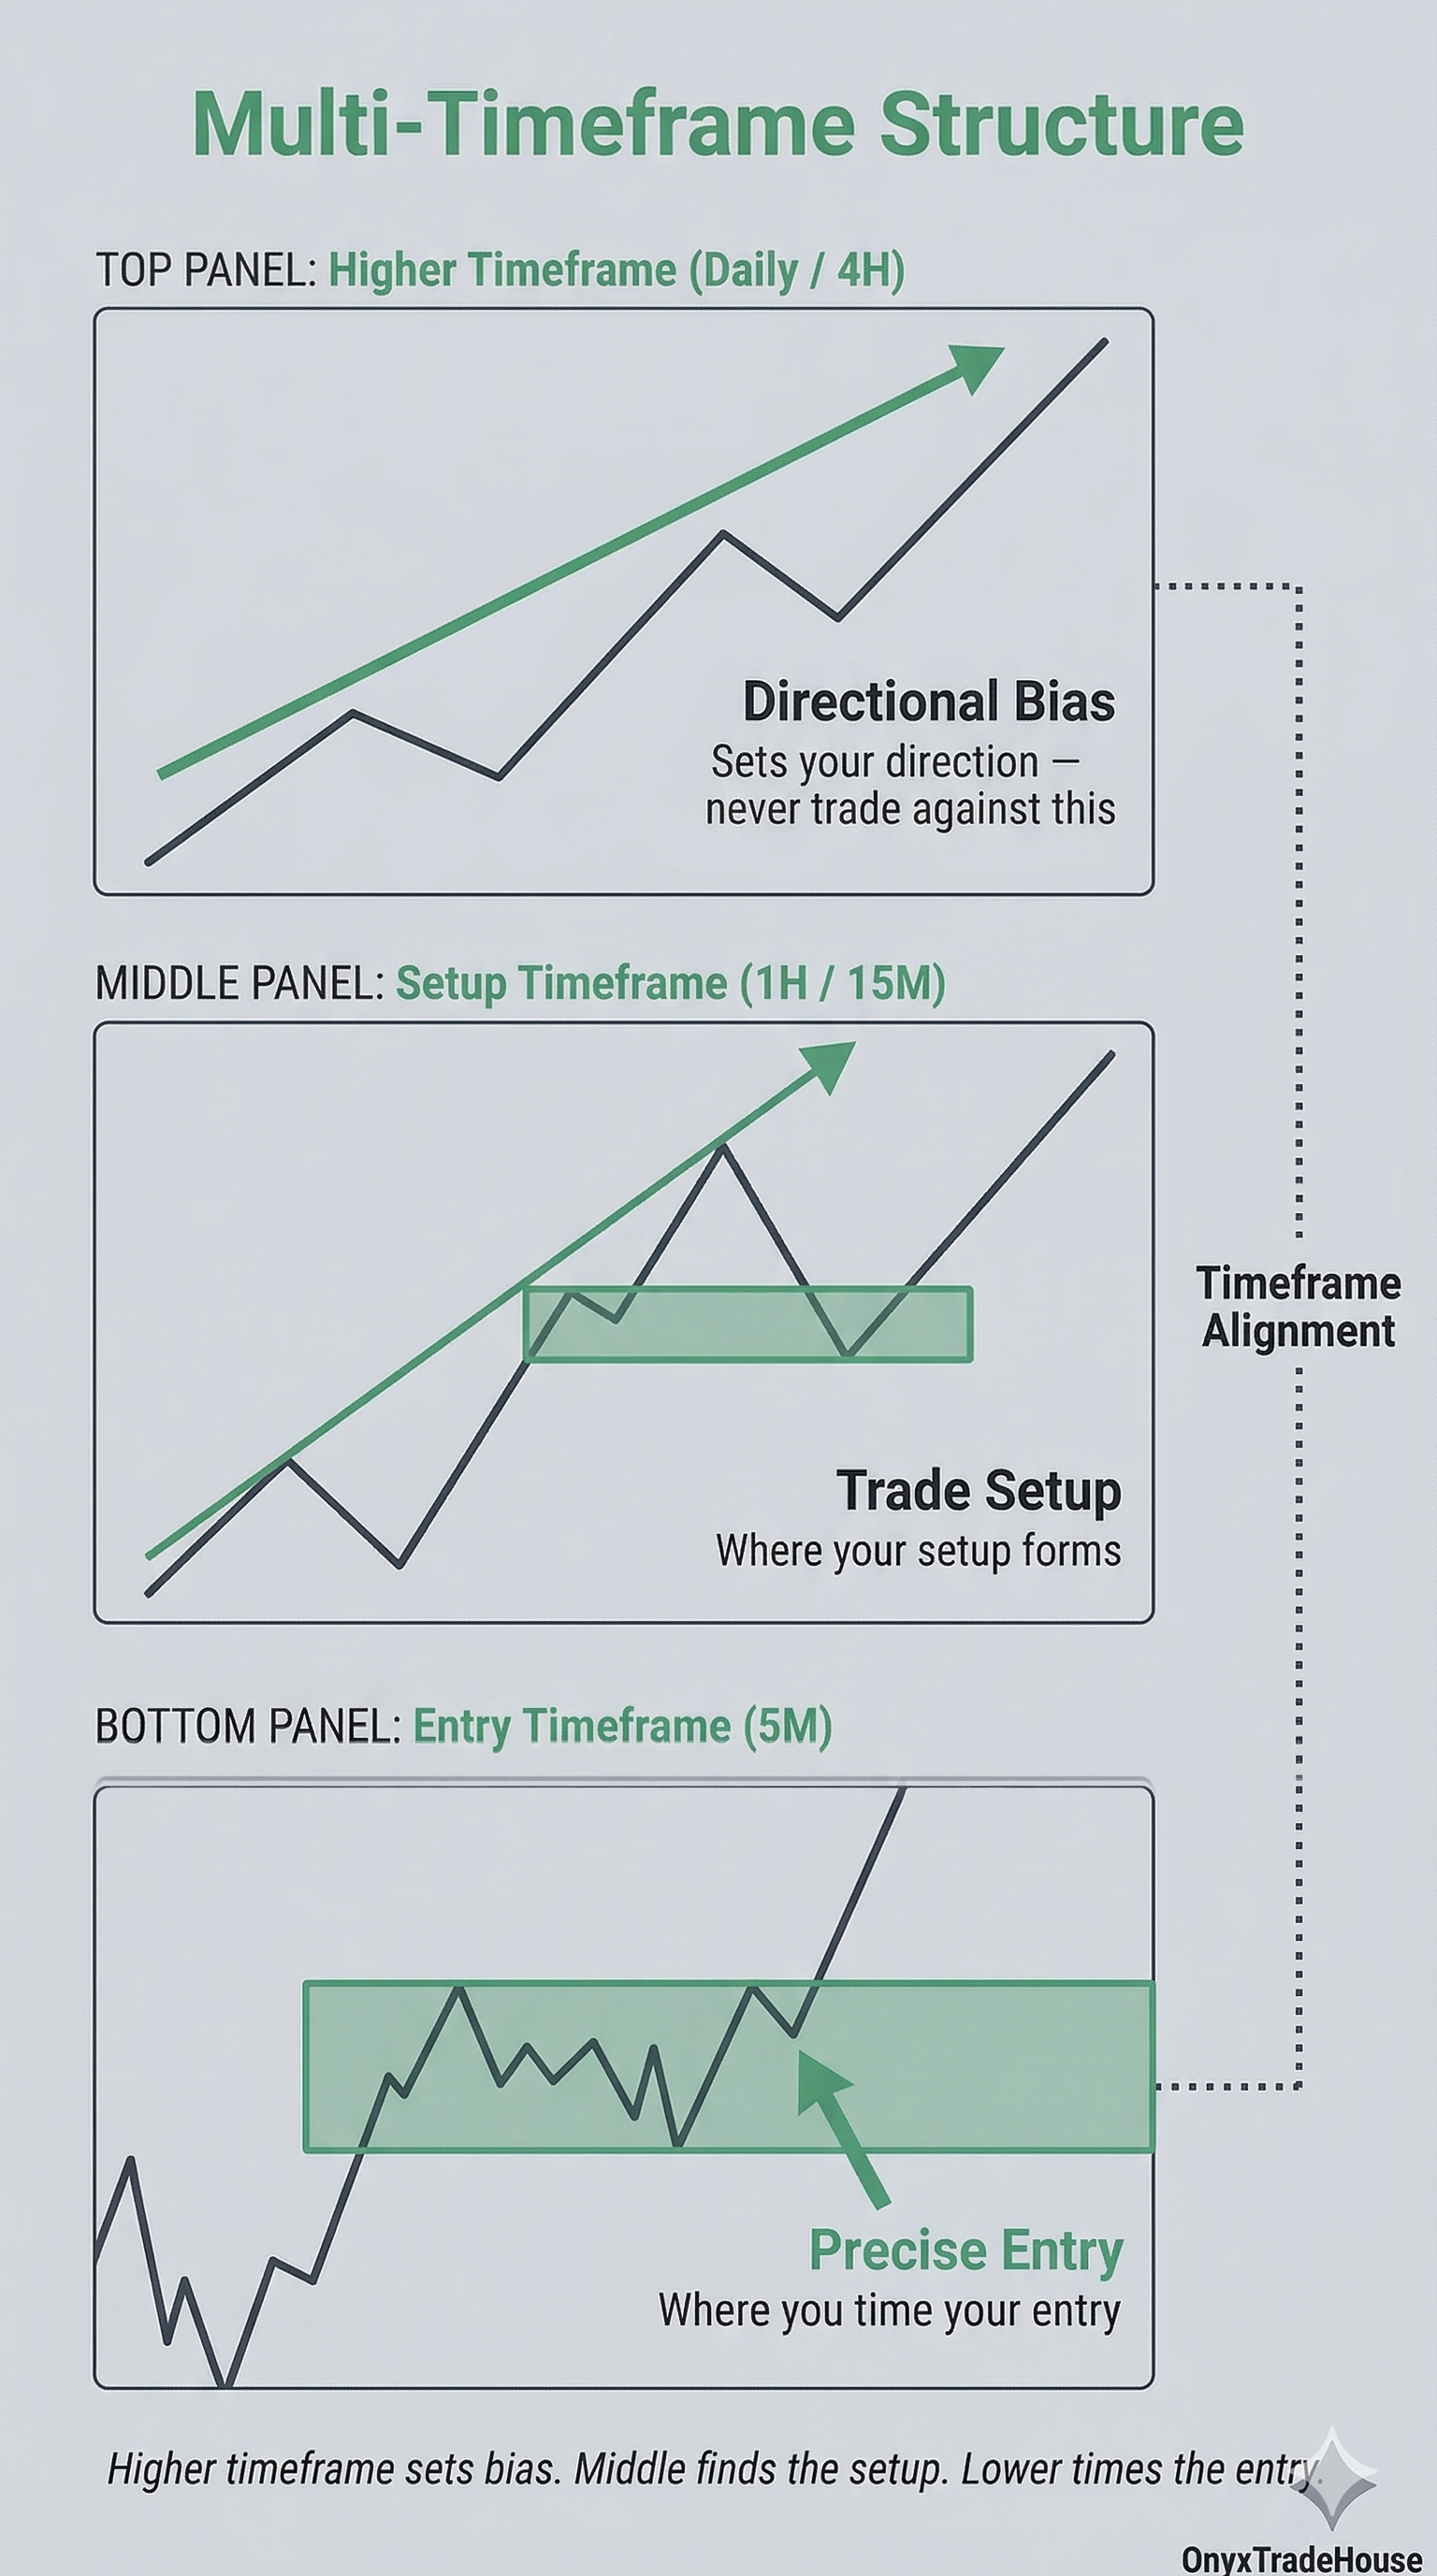
Step 4 — Apply it across timeframes
Market structure exists on every timeframe simultaneously. The structure on the daily chart gives you the directional bias. The structure on the one-hour chart gives you your setup. The structure on the five-minute chart gives you your entry. Aligning all three is where high-probability opportunities emerge.
Why Market Structure Matters More Than Indicators
Most traders begin their journey with indicators — RSI, MACD, Bollinger Bands. These tools are not useless, but they are derivatives. They are calculated from price. Market structure is price. It is the source data, not a processed version of it.
When you read market structure directly, you are seeing what is actually happening — where momentum is building, where it is fading, where large participants have left footprints in the form of strong moves away from key levels.
Indicators will always lag. Structure does not lag because it is not a calculation. It is the record of what price has already done, and that record informs what is likely to happen next.
Common Mistakes When Reading Market Structure
Understanding the concept is one thing. Applying it consistently under live market conditions is another. These are the most common errors traders make:
- Marking too many swing points. Not every candle wick is a significant swing high or low. Over-marking creates noise and makes it impossible to see the real structure.
- Ignoring the higher timeframe bias. Taking a bullish trade on the five-minute chart when the daily chart is in clear bearish structure is one of the most common — and costly — mistakes in trading.
- Confusing a retracement with a reversal. Price pulling back within a bullish structure is normal and healthy. It does not mean the trend has ended. A reversal requires a clear Break of Structure on the relevant timeframe, not just a pullback.
- Reacting to every break of structure. Not every BOS is a trading signal. Context matters. A BOS in the direction of the higher timeframe trend carries weight. A BOS against it requires far more confirmation before acting.
Market Structure and Liquidity: The Next Layer
Once you can read market structure reliably, the natural next step is understanding liquidity — the pools of orders that accumulate above swing highs and below swing lows. Institutional participants move price toward these areas deliberately, engineering moves that trigger retail stop losses before reversing.
This is why you will often see price make a new high by just a few pips before reversing sharply — a liquidity grab. Understanding structure tells you the direction. Understanding liquidity tells you the mechanics of how price gets there.
The two concepts are inseparable in a complete trading framework.
Key Takeaways
- Market structure is the sequence of highs and lows that tells you who controls the market — buyers, sellers, or neither.
- Solidified Points are confirmed swing highs and lows — the reference points your entire analysis is built from.
- A Break of Structure signals a shift in momentum — not all breaks are equal, context and timeframe alignment matter.
- Higher timeframe structure sets your bias — never trade against it on a lower timeframe without strong reason.
- Indicators lag because they are derived from price — structure is the source data itself.
- Market structure and liquidity work together — structure gives you direction, liquidity explains the mechanics of how price moves.
Market structure is the first chapter of the OnyxTradeHouse framework for a reason — it is the foundation everything else is built on. If you want to go deeper into how structure connects to liquidity, order flow, and the three proprietary trading models we use in live markets, the research paper covers the complete framework from first principles through to execution.